 |
| Home |
HOPE: Health Optimisation Protocol for Energy-efficient Buildings |
|||||||||
|
|||||||||
| Results | |
| Introduction Performance Criteria Protocol for building Evaluation | |
Multidisciplinary field study in 164 buildings A multidisciplinary study has been carried out in a total of 164 buildings (66 office buildings and 98 apartment buildings) in nine European countries. In each of these buildings, data were collected by means of building checklists and the occupant questionnaires. Essential criteria for each building:
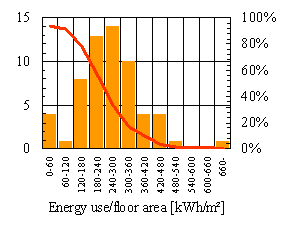
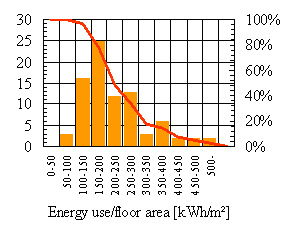
In view of the difficulties encountered in building recruitment the requirements have been relaxed. Most examined buildings are relatively large, with an average floor area of almost 15000 m2 for the office buildings and anaverage floor area of 10000 m2 for the apartment buildings. Some Results The distribution of energy use of investigated buildings is shown in the graphs below:
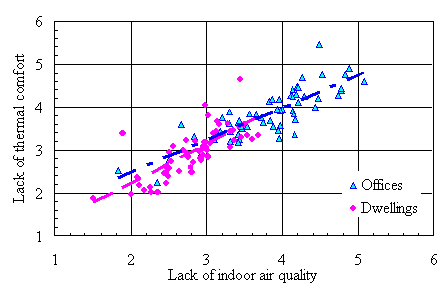
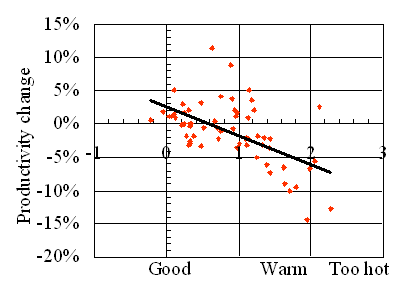
A specially high value is obtained for the correlation between thermal comfort and air quality (>0.8 for residential and office buildings): Economic benefits can be a strong driver for investments for improvement of the indoor environment. Figure below shows the self-estimated effect of thermal comfort on productivity in the investigated office buildings. It is clear that warm thermal discomfort leads to a significant decrease of productivity:
The buildings are sorted basically into two classes, which are "poor", "not satisfactory" or "red" on one hand; and "good", "satisfactory", or "green" on the other hand. A "veto" class is added to take account of very poor level for a given criterion. If the position of the building is not clear, it is sorted in an intermediate, uncertain or yellow class There are no significant differences between green and red office buildings about population in each age class and sex, percentage of women and ancient smokers, ownership, presence of air pollution and noise sources, height of surrounding buildings, and smoking allowance. Ori-entation of glazing is also similar. Some more significant differences are shown in the following table, Some significant (P< 5%) differences between "green" and "red" office buildings:
The occupants of green buildings perceive that they have a better control on their environment, in particular for ventilation, than in red buildings. The decoration, layout and cleanli-ness, as well as the speed of response to complaints are all significantly better in green buildings. Occupants of red buildings spend more time working with a computer. In all green buildings, all or a part (in one building) of the windows can be opened. In seven of the 15 red buildings, windows cannot be opened. Perceived productivity is better in green buildings, and absenteeism because of indoor envi-ronment is smaller (95% of workers without absence against 87% in red buildings). The Airless recommendations (Bluyssen, Cox et al. 2003) are completely or partly followed in green buildings, while they are only partly or not respected in red buildings Principal conclusions The following conclusions related to energy and well-being can be drawn from this analysis:
|


